
Remote Debugging is a great feature to use, especially when you work with virtual machines. It allows you to develop and debug locally but have the code running on another machine, virtual or physical. Microsoft SharePoint can’t be installed on a Windows Vista or XP workstation, but needs to be installed on Windows Server 2003 or 2008, so the general recommendations has been for developers to have either Windows Server as their main OS or have a virtual machine with Windows Server. None of these work that well; either you have problems debugging your components and you have to rely on traces or message boxes or you have to have a virtual machine with a full development environment, which will not resemble a production machine.
So, Remote Debugging, is my primary way when working with SharePoint development. It allows you to have a smaller virtual machine, and it will allow you to develop in your main OS. But, Remote Debugging has been quite problematic to set up and configure, so here is a guide that you can follow to get it work in a few minutes.
This guide uses Microsoft Visual Studio 2008 and Windows Vista with UAC on the client and a Windows Server 2003 with WSS 3.0 running in a Virtual PC on the client.
Prepare your remote host
First of all you need to prepare your remote host for accepting incoming debugging requests, this is done by running the Visual Studio Remote Debugging Monitor on the remote machine, which is found under C:\Program Files\Microsoft Visual Studio 9.0\Common7\IDE\Remote Debugger\. Copy that folder to your remote host and place a shortcut to the msvsmon.exe on the desktop, so you have fast access to it whenever you need to debug.
The Remote Debugging Monitor is the one accepting your debug calls and the talking back to Visual Studio on your client, so to get these things to work you have to start the client as the user running Visual Studio (or have administrative permissions on the client). You can either log in to the remote host using that user or, as I prefer, right-click on the msvsmon.exe and choose Run As… Make sure that the user you are using to run the monitor with is member of the local Administrators group.
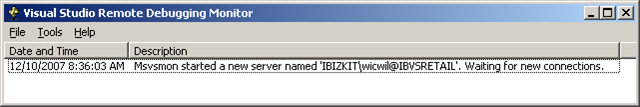
Now the Remote Debugging Monitor has started to waiting for new debugging connections. The debugging server was named with the username that is running the application and the server name, separated with an @-character. You can rename it using Tools->Options.
Prepare your client
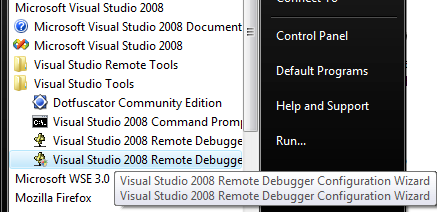 Now it’s time to prepare your client. First of all you have to run the Visual Studio 2008 Remote Debugger Configuration Wizard, which will open up the correct ports in your firewall. You will find the wizard under the Visual Studio Tools in your start menu. The wizard also allows you to run the Remote Debugger as a service on the machine which the wizard is run on, skip this step for this guide. When the wizard asks you for how you would like to configure your firewall, choose the Allow only computers on the local network… option and the finish the wizard.
Start Debugging
Now it’s time to start Visual Studio 2008 and load up your solution and hook up the debugger to the remote machine. Prior to this you need to deploy the application to be debugged on the remote machine, including the .pdb files.
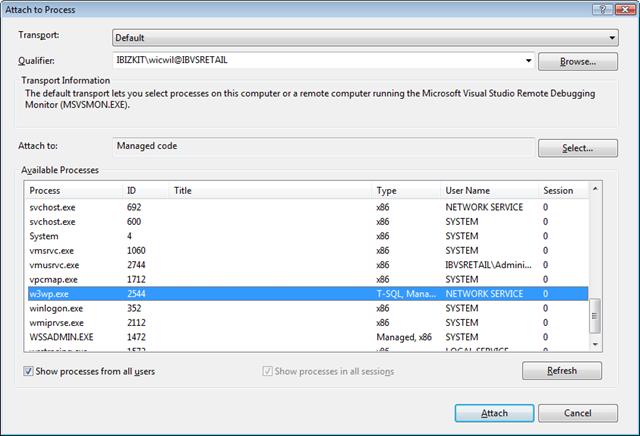
In Visual Studio choose Debug->Attach to process. In the Qualifier you have to enter the name that was given to the Remote Debugger Monitor and hit Enter, then all you need to do is attach to the process you would like to debug and set some break points!
That wasn’t to hard?
Problems
Here are some problems that I have stumbled upon when trying to get these things to work.
Unable to connect to the Microsoft Visual Studio Remote Debugging Monitor named ‘XXX. The Visual Studio Remote Debugger on the target computer cannot connect back to this computer. Authentication failed. Please see Help for assistance.
This one is due to the fact that the user running the debugging monitor are not allowed to access the client machine, make sure that the user running the monitor is either the same user running Visual Studio or the member of the Administrators group on your client.
You only see a few processes in the Attach to Process dialog.
First of all make sure you have checked the Show processes from all users check box, then make sure that the user running the monitor has access to the process on the machine, that is you have to make the user member of the local Administrators group. After adding the account to the Administrators group you have to restart the monitor.
Unable to connect to the Microsoft Visual Studio Remote Debugging Monitor named ‘ibvsretail’. Logon Failure: The target account name is incorrect.
This one is pretty uncommon, but still I have had it. Somehow the server account in Active Directory had gone wrong so I hade to remove the machine from the domain and add it back.